Why Use Parameter Device Analyzers And Curve Tracers? The answer begins with better visibility into semiconductor behavior. These instruments measure electrical characteristics under controlled conditions. They reveal how voltage, current, temperature, and timing affect a device.
A parameter analyzer can apply precise voltage or current steps. It can then record leakage, threshold voltage, resistance, and breakdown behavior. Curve tracers display these relationships as clear, readable graphs. A technician may see a sudden knee, unstable region, or unexpected current rise within seconds. That visual evidence often explains failures that ordinary multimeters cannot isolate.
Practical testing depends on disciplined setup. Probes must contact clean surfaces. Cables need suitable shielding. Temperature should remain stable during repeated measurements. Experienced engineers also compare new data with trusted reference samples. This practice improves confidence and exposes gradual process changes. Small differences matter.
Yet these tools are not automatically accurate. Poor grounding can create misleading curves. Excessive measurement speed may hide transient behavior. Even experienced users can misread a graph when device history is unknown. That limitation deserves attention. Reliable conclusions require documented test conditions, repeat measurements, and careful interpretation.
Parameter Device Analyzers And Curve Tracers support research, production testing, quality control, and failure analysis. They help engineers connect numerical results with physical device behavior. Used thoughtfully, they turn complex semiconductor measurements into actionable evidence. Their greatest value is not simply collecting data. It is helping people ask better technical questions.
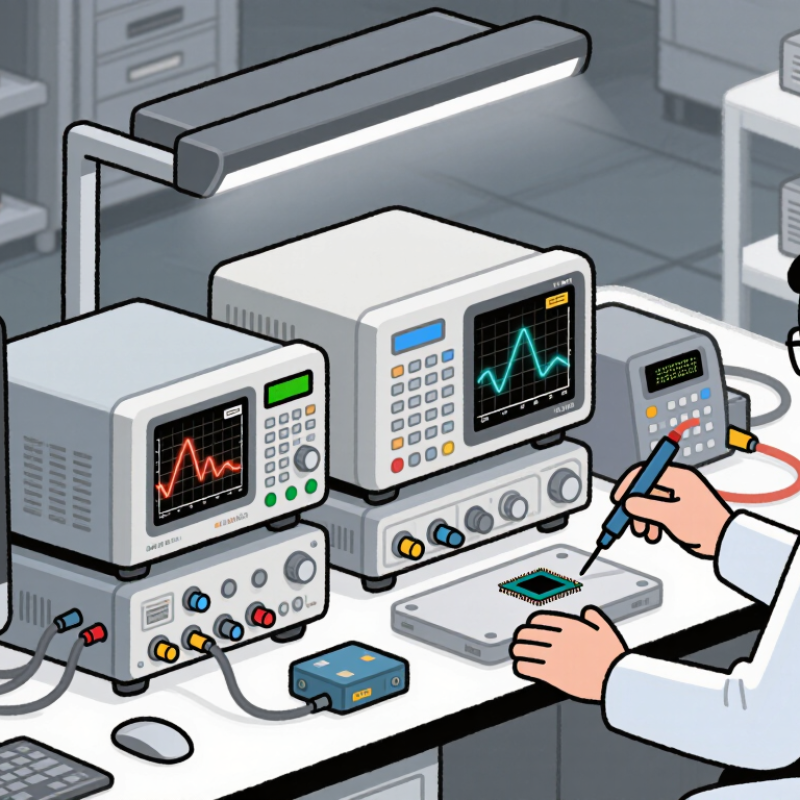
A parameter device analyzer earns its value through accuracy, range, and four-quadrant operation. It measures tiny leakage currents while applying controlled voltage or current. This matters when transistor behavior changes near breakdown, threshold, or subthreshold regions. The 2023 International Roadmap for Devices and Systems highlights tighter variability control as logic technology approaches 2 nm-class production. Small measurement errors can therefore distort device decisions.
Range must match the device, not merely exceed its rating. A wide voltage span supports breakdown testing, while sensitive current ranges reveal leakage below the nanoampere level. Four-quadrant operation allows the source-measure unit to source or sink power. That capability is essential for rechargeable cells, LEDs, and power devices with regenerative behavior. The SEMI World Fab Forecast 2024 estimated global fab equipment spending above 100 billion dollars, showing how much investment depends on reliable process measurements. Still, expensive equipment cannot correct poor guarding, unstable cabling, or an unsuitable test fixture.
Tips: Verify accuracy across the full range, not only at one calibration point. Use guarded connections for low-current tests. Check settling time before recording curves. A clean graph can still hide thermal drift. This is where many evaluations become too optimistic. Document compliance limits and polarity settings before testing. Small notes prevent large interpretation errors.
Modern semiconductor development demands more than a pass-or-fail reading. Parameter device analyzers and curve tracers show how devices behave across voltage, current, temperature, and time. The WSTS Spring 2024 forecast projected global semiconductor sales of $611.2 billion for 2024. That scale increases pressure for repeatable, traceable measurements.
I–V sweeps reveal threshold shifts, contact resistance, and abnormal conduction. C–V measurements expose capacitance changes and interface effects. Leakage testing can identify weak insulation before failure becomes visible. Breakdown tests show where current rises sharply, but protection limits must be configured carefully. Small errors matter.
For bipolar devices, hFE measurements connect base current with collector current under controlled conditions. Engineers can compare production lots, screen prototypes, and investigate drift. The 2023 International Roadmap for Devices and Systems stresses tighter process control as device structures become more complex. A curve tracer helps make that variation visible.
In practical work, a clean probe setup is essential. I have seen unstable contacts imitate device defects. That result is not enough. Cable resistance, temperature, sweep speed, and compliance settings can change the curve. Repeating the test at several temperatures often reveals a different story. Reports from SEMI also continue to emphasize process control and measurement capability across advanced manufacturing. Good data needs context, not just a graph.
Parameter device analyzers and curve tracers turn transistor behavior into measurable evidence. For power-device evaluation, their strongest value appears during JEDEC-style DC sweeps and safe operating area testing. A curve tracer applies controlled voltage and current while recording device responses. Each trace shows leakage, threshold behavior, saturation, breakdown, and current limits.
Set the drain-voltage steps, gate-voltage increments, compliance limits, and temperature conditions before testing. Keep leads short and connections mechanically secure. Small wiring errors can distort high-current traces. A properly configured sweep helps engineers compare measured curves with datasheet limits and design targets. It also exposes weak devices that pass a simple continuity check.
Safety matters at every step. Use current limiting, guarded fixtures, emergency shutdowns, and temperature monitoring. The safe operating area can shrink sharply as the device heats. Never treat one clean curve as complete proof. My first instinct would be to increase voltage quickly, but that approach can hide thermal stress and damage the sample. Slower ramps provide better control and clearer evidence. Repeating the sweep at different temperatures adds useful perspective. Record the instrument settings, fixture condition, ambient temperature, and unusual trace changes. Those details make results easier to review, reproduce, and trust.
JEDEC-style DC sweeps reveal transistor output characteristics, while the safe-operating-area envelope helps verify voltage, current, and power limits during testing.
Representative silicon NPN test data at 25°C. Each curve shows collector current versus collector-emitter voltage at a fixed base current. The dashed boundary represents a 50 W power-limited reference envelope with a 5 A current ceiling, illustrating how a curve tracer can identify safe operating margins.
The 650 V GaN and 1.2 kV SiC classes require different test thinking. A 2024 Yole Group power GaN report forecasts rapid market expansion, with demand moving beyond chargers toward data-center converters. A separate 2024 SiC market report projects multi-billion-dollar growth before 2030. These figures matter because higher volume increases the cost of weak screening.
For 650 V GaN devices, a parameter analyzer can measure gate leakage, threshold voltage, drain leakage, and dynamic on-resistance. GaN often switches quickly, so ordinary static measurements can miss trapping effects. A pulsed curve tracer reveals current collapse after high-voltage stress. Keep the pulses short. Heat can distort the result.
The 1.2 kV SiC class demands wider voltage margins and stronger protection. Engineers typically examine breakdown behavior, body-diode characteristics, gate-oxide leakage, and temperature-dependent on-resistance. The test fixture must control parasitic inductance; otherwise, a harmless overshoot may look like device failure. IEC 60747-8 and JEDEC power-device guidance provide useful reference points, but they do not replace application-specific limits.
The boundary is not perfectly clean. I still distrust any comparison using only room-temperature curves. A device that passes at 25°C may behave differently near 175°C.
Qualification decisions become stronger when electrical evidence connects directly with recognized standards. IEC 60747 provides device-specific measurement principles and performance expectations. JEDEC JESD47 supports qualification through defined stress tests, sample plans, and acceptance criteria. Together, they help engineers judge whether a semiconductor device remains stable after temperature, humidity, bias, or endurance exposure.
Parameter device analyzers measure leakage, breakdown voltage, threshold voltage, capacitance, and on-state resistance with controlled accuracy. Curve tracers reveal how current changes across voltage, temperature, and operating regions. Curves reveal drift. A small knee shift may indicate emerging breakdown behavior before a simple pass-fail test detects it. In practical laboratory work, comparing pre-stress and post-stress plots often exposes failures hidden by average values.
Reliable decisions require more than attractive graphs. Engineers should record instrument settings, fixture conditions, calibration status, and measurement uncertainty. They should also compare results with the applicable IEC 60747 requirements and JESD47 qualification plan. A clean curve can still hide poor contact resistance or an unstable test temperature. That deserves scrutiny. Our first test setup may be convenient, but not fully representative. Reviewing failed units, retesting selected samples, and documenting deviations improves confidence without masking uncertainty.
It records leakage, threshold behavior, saturation, breakdown, and current limits under controlled voltage and current.
Set voltage steps, gate-voltage increments, current limits, temperature conditions, and shutdown limits before testing.
Loose connections and long leads can distort high-current traces. Small wiring errors matter.
Use current limiting, guarded fixtures, emergency shutdowns, and temperature monitoring. Safety comes first.
Slow ramps reduce thermal stress and reveal clearer device behavior. Fast ramps can hide damage.
Record instrument settings, fixture condition, ambient temperature, and unusual trace changes for later review.
Short pulses can expose current collapse after high-voltage stress. Heat may distort the result.
Wider voltage margins and parasitic inductance can create misleading overshoot. A harmless spike may resemble failure.
No. Repeat tests at different temperatures and review several operating conditions.
Room-temperature curves may look acceptable, while behavior changes significantly at elevated temperatures. I would not overtrust one test.
Parameter Device Analyzers And Curve Tracers provide a structured way to evaluate semiconductor components across a wide range of electrical conditions. By combining high accuracy, broad current and voltage ranges, and four-quadrant operation, SMU analyzers can measure I–V behavior, C–V characteristics, leakage current, breakdown performance, and transistor hFE. These measurements help engineers understand device performance, identify limitations, and verify repeatability during development and production testing.
Curve tracers complement these capabilities by generating controlled, JEDEC-style DC sweeps and displaying device curves for direct analysis. They are especially valuable for examining safe operating areas and comparing power-device test requirements, such as 650 V GaN devices and 1.2 kV SiC devices. When measurement results are evaluated alongside IEC 60747 and JEDEC JESD47 guidance, engineers can make better-informed qualification decisions, improve reliability assessment, and establish consistent test procedures for new semiconductor technologies.